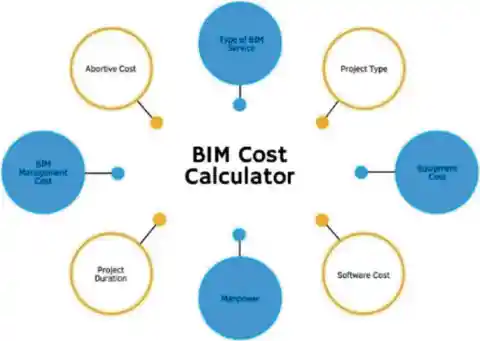
BIM services cost per project ranges from roughly $500 for a small single-family residential model to over $500,000 for a large hospital or industrial facility, with per-square-foot benchmark rates of $0.10–$0.60 per sq ft per discipline depending on Level of Development (LOD), number of disciplines, and service scope. Three pricing structures dominate the market — fixed fee, hourly, and a percentage of construction cost (typically 0.5–3%). Understanding which variables drive BIM cost allows project owners, contractors, and engineers to scope services accurately, write watertight contracts, and avoid the scope creep that consistently inflates BIM budgets.
• Per-sq-ft benchmark: $0.10–$0.60 per discipline — position depends on LOD and complexity
• Percentage of construction cost: 0.5–3% for full-service multidiscipline engagements
• LOD is the single largest cost lever — LOD 500 (as-built) can cost 5–7× an LOD 100 conceptual model
• Clash detection delivers the highest measurable ROI of any BIM service line item
• Offshore modelling rates (India, Eastern Europe) run approximately one-third of comparable US rates
Table of Contents
Factors That Affect BIM Services Cost Per Project
BIM service pricing is not standardised across the industry. Multiple variables interact to determine the final fee. A clear understanding of each one is a prerequisite for building an accurate budget and writing a contract that does not generate change orders.
Level of Development (LOD)
LOD — defined under the AIA Document E203 and the BIMForum LOD Specification — is the single most powerful cost driver. Each LOD tier specifies how much geometric precision and non-graphic information (material, manufacturer, assembly, performance data) must be authored and verified by the model author:
- LOD 100 — Conceptual massing only. Minimum modelling effort; suitable for area and volume studies.
- LOD 200 — Approximate geometry, generic assemblies. Standard for schematic design.
- LOD 300 — Specific geometry, size, shape, and location. The common design deliverable for documentation.
- LOD 350 — Includes connections, interfaces, and clearances between disciplines. Minimum LOD for reliable clash detection.
- LOD 400 — Fabrication and assembly detail. Used for prefabrication and structural steel shop drawings.
- LOD 500 — Field-verified as-built. Required for FM handover; highest modelling cost.
Number of Disciplines
Each discipline — architectural, structural, mechanical, electrical, plumbing, fire protection, civil — is modelled and billed separately. A single-discipline architectural model costs a fraction of a fully coordinated multidiscipline model. Coordination overhead (clash detection, model merging, issue resolution cycles) is additional and scales non-linearly with discipline count.
Project Complexity and Gross Area
Gross floor area is the baseline quantity multiplier, but complexity compounds it. Curved geometry, long-span framing, dense MEP riser zones, or process piping in industrial facilities all increase modelling hours relative to a rectilinear structure of equivalent area. On a high-complexity project, cost per square foot can run 2–3× a straightforward building of identical area.
Geographic Region and Labour Rates
Offshore modelling hubs — primarily India, the Philippines, Eastern Europe, and Southeast Asia — offer BIM modelling rates roughly one-third of comparable US or UK in-house rates. Most mid-to-large BIM service providers use a hybrid model: offshore production teams for volume modelling, with local BIM coordinators and managers for client-facing work and clash resolution.
Pricing Model and Scope Definition
Fixed-fee, hourly, and percentage-of-construction-cost contracts each allocate scope risk differently. Hourly contracts on evolving scopes consistently run over initial estimates when revision allowances are not capped.
Turnaround Time and Revision Allowance
Compressed schedules carry surcharges. Revision rounds beyond the contracted allowance are billed as change orders. An LOD 300 model with unlimited revisions can ultimately cost more than an LOD 350 model delivered under a defined revision cap.
BIM Services Cost by Project Type
The ranges below are planning benchmarks based on industry-quoted pricing. They represent complete project BIM fees, including base modelling and standard coordination, at the typical LOD for each project type. Treat them as order-of-magnitude figures.
| Project Type | Typical BIM Cost Range | Disciplines Assumed | Notes | ||
|---|---|---|---|---|---|
| Small Residential (single-family) | $500 – $3 | 000 | Architectural only | LOD 200–300; limited scope | |
| Medium Residential / Small Multifamily | $3 | 000 – $10 | 000 | Architectural + structural | LOD 300 |
| Large Residential / Luxury | $10 | 000 – $50 | 000 | Architectural + structural + MEP | Full coordination |
| Commercial (office / retail) | $5 | 000 – $100 | 000+ | Multidiscipline | Varies with floor area and LOD |
| Industrial Facility | $15 | 000 – $150 | 000+ | Structural + MEP + process | Dense process piping drives cost |
| Infrastructure / Civil | $20 | 000 – $300 | 000+ | Civil + structural | Corridor complexity is the key variable |
| Healthcare / Hospital | $50 | 000 – $500 | 000+ | Full multidiscipline | Most complex MEP; highest coordination overhead |

BIM Cost by Service Type
BIM is not a single service. The fee structure depends entirely on which services are engaged. Base modelling, coordination, 4D scheduling, quantity takeoff, and FM data handover are each distinct service lines with separate cost drivers.
Architectural, Structural, and MEP Modelling
Base modelling is quoted per discipline per square foot. MEP is consistently the most expensive discipline because of the complexity of routing geometry, service sizing, equipment families, and the number of sub-disciplines (mechanical, electrical, plumbing, fire protection) that must be authored and coordinated. Structural sits between architectural and MEP in both complexity and fee.
| Discipline | Typical Per-Sq-Ft Rate | Common LOD Target |
|---|---|---|
| Architectural | $0.10 – $0.25 | LOD 200–300 |
| Structural | $0.15 – $0.35 | LOD 300–350 |
| Mechanical (HVAC) | $0.15 – $0.40 | LOD 300–350 |
| Electrical | $0.10 – $0.30 | LOD 300–350 |
| Plumbing | $0.10 – $0.30 | LOD 300–350 |
| Fire Protection | $0.10 – $0.25 | LOD 300–350 |
Clash Detection and BIM Coordination
BIM coordination — federating discipline models in Navisworks or a similar environment, running automated clash detection, managing issue logs, and tracking resolution — is the highest-ROI BIM service for multidiscipline projects. It is typically quoted at $0.05–$0.25 per sq ft on top of base modelling, or as a weekly or monthly coordination retainer on large, long-duration projects.
4D BIM — Construction Scheduling
4D BIM links model elements to the construction programme (Primavera P6, MS Project, Asta Powerproject) to simulate construction sequences and identify programme conflicts before site mobilisation. This service typically adds 10–25% to the base modelling fee, depending on the granularity of the construction schedule and the number of construction phases to be animated.
5D BIM — Cost Estimation and Quantity Takeoff
5D BIM extracts element quantities directly from the model and links them to cost data, eliminating manual quantity surveying for the elements defined in the BIM scope. This service adds approximately 10–20% to the base modelling cost. Accuracy is directly proportional to LOD — a 5D takeoff from an LOD 200 model carries substantial uncertainty and should not substitute for a traditional quantity survey on cost-sensitive projects.
6D BIM — Facility Management Data
6D (FM BIM) populates asset-level data — manufacturer, model number, warranty period, maintenance schedule, COBie parameters — into model elements for handover to a Computer-Aided Facilities Management (CAFM) system. Cost is driven by the volume and richness of asset data required, not by geometry, and is typically quoted on a per-asset or day-rate basis rather than per square foot. It is most commonly required on public-sector and healthcare projects where FM data handover is a contractual obligation.
Scan-to-BIM — Point Cloud to BIM
Scan-to-BIM converts laser-scan point clouds of existing structures into BIM models for renovation, refurbishment, or heritage projects. Field laser scanning and point cloud registration are priced separately from the modelling work itself.
| Scope | Typical Rate |
|---|---|
| Point cloud registration only (no modelling) | $0.05 – $0.15/sq ft |
| Scan-to-BIM modelling — LOD 200–300 | $0.15 – $0.40/sq ft |
| Scan-to-BIM modelling — LOD 400–500 | $0.35 – $0.60/sq ft |
BIM Management and Consultancy
BIM management — authoring BIM Execution Plans (BEPs), managing Common Data Environments (CDE), running coordination meetings, quality-checking models against the project BIM requirements — is billed hourly or on a monthly retainer. This is distinct from modelling work and is required on all multidiscipline projects above a certain size. BIM management fees typically represent 15–25% of total BIM project cost on well-coordinated, multidiscipline engagements.
LOD Level and Its Impact on BIM Cost
The BIMForum LOD Specification (2021 edition) defines what model authors are authorised to claim about each model element at each LOD. Cost rises with each tier because more hours are required to author, coordinate, and verify higher-LOD elements. The table below expresses cost as a relative index, with LOD 100 as the baseline.
| LOD | Description | Relative Cost Index | Primary Use |
|---|---|---|---|
| LOD 100 | Conceptual massing — no specific geometry | 1× | Pre-design; area and volume studies |
| LOD 200 | Approximate geometry; generic systems | 1.5× | Schematic design; early coordination |
| LOD 300 | Specific geometry; precise size and location | 2×–2.5× | Design documentation; permit drawings |
| LOD 350 | Includes connections and discipline interfaces | 3× | Reliable multidiscipline clash detection |
| LOD 400 | Fabrication and assembly detail | 4×–5× | Steel fabrication; prefabrication; shop drawings |
| LOD 500 | Field-verified as-built; coordinated with site | 5×–7× | FM handover; operations and maintenance |
BIM Pricing Models Explained
Three pricing structures dominate the BIM services market. Each carries a different risk profile for the client and the service provider.
Fixed Fee
The provider delivers a named set of models at a named LOD for a fixed price. This is the most common pricing structure for well-defined scopes and gives the most cost certainty for the client. It requires a tight scope definition — LOD per discipline, number of authorised revision rounds, named deliverable formats, and model-checking requirements — to prevent change orders. Any work outside the contracted scope is quoted separately.
Hourly / Time-and-Materials
The provider bills time at agreed rates with no fixed ceiling. Best for evolving, research-intensive, or fast-changing scopes where deliverables cannot be fully defined at project outset. Scope risk is carried by the client. Without a budget ceiling clause, hourly contracts on complex multidiscipline projects consistently exceed initial estimates.
Percentage of Construction Cost
The BIM fee is set as a percentage of the total construction value, typically 0.5–3% for full-service multidiscipline engagements. The percentage decreases as project value increases, following the same curve as professional fee structures in architecture and engineering.
| Construction Value | Typical BIM Fee (% of Construction Cost) |
|---|---|
| Below $1M | 2 – 3% |
| $1M – $5M | 1.5 – 2.5% |
| $5M – $20M | 1 – 2% |
| $20M – $100M | 0.5 – 1.5% |
| Above $100M | 0.25 – 0.75% |
BIM Cost Per Square Foot — Benchmarks
Per square foot is the most practical unit for comparing BIM modelling quotes across providers. The rates below are per discipline; multiply by the number of disciplines and add coordination separately. All figures are in USD.
| BIM Service | Low (simple; low LOD) | Mid (typical) | High (complex; high LOD) |
|---|---|---|---|
| Single-discipline modelling | $0.10/sq ft | $0.20/sq ft | $0.35/sq ft |
| Full multidiscipline (3–5 disciplines) | $0.30/sq ft | $0.60/sq ft | $1.20/sq ft |
| Multidiscipline + clash detection | $0.35/sq ft | $0.80/sq ft | $1.50/sq ft |
| Scan-to-BIM (LOD 300) | $0.15/sq ft | $0.30/sq ft | $0.45/sq ft |
| Scan-to-BIM (LOD 400–500) | $0.35/sq ft | $0.50/sq ft | $0.60/sq ft |
BIM Professional Hourly Rates by Region
Hourly rates vary by role, seniority, and region. The offshore-vs-onshore rate differential is the primary economic driver behind the hybrid delivery models used by most large BIM service providers globally.
| Role | USA (USD/hr) | UK (GBP/hr) | India Offshore (USD/hr) |
|---|---|---|---|
| BIM Modeller / Drafter | $40 – $90 | £28 – £50 | $15 – $30 |
| BIM Coordinator | $60 – $120 | £35 – £65 | $20 – $40 |
| BIM Manager | $90 – $150 | £50 – £80 | $25 – $50 |
| VDC Engineer / BIM Lead | $100 – $180 | £60 – £95 | $35 – $60 |
ROI of BIM Services
The two most widely cited independent bodies of BIM ROI evidence come from Stanford University's Center for Integrated Facilities Engineering (CIFE) and McGraw-Hill Construction (now Dodge Data & Analytics).
"Clash detection can deliver savings of up to 10% of contract value through early identification and resolution of design conflicts before construction begins."
Stanford CIFE Benchmarks
The CIFE compiled BIM benefit metrics from 32 major projects, producing the following benchmarks widely referenced in US Government (GSA) and Autodesk BIM guidance:
- Up to 40% elimination of unbudgeted change orders
- Cost estimation accuracy within 3% (vs 10–15% for manual methods)
- Up to 80% reduction in time required to generate a cost estimate
- Up to 10% of contract value saved through clash detection
- Up to 7% reduction in overall project delivery time
McGraw-Hill SmartMarket Data
McGraw-Hill Construction's SmartMarket Report, The Business Value of BIM in North America (2007–2012), surveyed contractors, architects, and engineers across the US, Canada, and Brazil. Key finding: 74% of contractors reported a positive perceived ROI on BIM, compared to 63% of architects. The higher contractor ROI reflects the direct exposure of trades to rework costs and the measurable labour savings that clash detection delivers during construction.
When Does BIM Pay for Itself?
The break-even condition for BIM coordination is straightforward:
BIM Coordination Fee ≤ (Expected Rework Avoidance Rate × Construction Value)On a $5M construction project with a 1% BIM coordination fee ($50,000), a rework avoidance rate of just 2% ($100,000) doubles the BIM investment. On dense MEP projects (hospitals, data centres, industrial) the rework avoidance rate is highest, making the break-even calculation strongly positive. On simple, single-discipline residential projects below approximately $500,000 in construction value, BIM coordination typically does not pay for itself.
How to Get an Accurate BIM Quote
- 1Define Gross Floor Area and DisciplinesState the total gross floor area in sq ft or m². List every discipline to be modelled — architectural, structural, mechanical, electrical, plumbing, fire protection, civil. Note whether phased areas or design alternates will be modelled separately, as these multiply scope.
- 2Specify LOD Per DisciplineAssign a target LOD to each discipline using the BIMForum LOD Specification. Do not default to maximum LOD across all disciplines. Specify the LOD that is actually required for each downstream use: LOD 300 for documentation, LOD 350 for reliable clash detection, LOD 400 only where fabrication models are needed.
- 3Define Deliverables, Formats, and Checking RequirementsState the native file format required (RVT, IFC, NWD), all export formats (IFC 2×3, IFC 4, DWG, PDF), and model quality-checking requirements (e.g., Solibri Model Checker against the project BIM Requirements).
- 4Set a Revision AllowanceAgree on a fixed number of revision rounds included in the base fee. Unlimited revisions are a consistent source of BIM budget overrun. Specify the number of model review cycles and what constitutes a chargeable change.
- 5Request Itemised Quotes Per Discipline and ServiceAsk providers to quote each discipline and each service line — modelling, coordination, 4D, QTO, FM data — separately. Bundled lump-sum quotes obscure scope and prevent meaningful comparison between providers.
- 6Normalise Quotes to Per-Sq-Ft Per-Discipline RateConvert all quotes to a per-sq-ft per-discipline rate. Verify that all quotes reference the same LOD specification and revision allowance before comparing. A quote that appears lower may be at a lower LOD or exclude coordination entirely.
Frequently Asked Questions
Conclusion
BIM services cost per project is determined primarily by Level of Development, number of disciplines, project complexity, and the pricing model used. Per-square-foot benchmarks — $0.10–$0.60 per discipline — provide a reliable planning reference, but accurate pricing requires a clearly scoped LOD specification per discipline, a defined revision allowance, and itemised quotes separated by service type.
The strongest ROI case for BIM rests on multidiscipline clash detection for projects above approximately $1–2M in construction value. Stanford CIFE and McGraw-Hill data consistently show that coordination savings materially exceed BIM fees at that scale. Below that threshold, the overhead of multidiscipline modelling typically outweighs the measurable return.
For any project, specifying LOD correctly — matched to actual downstream use rather than maximised by default — is the single most effective way to control BIM cost without sacrificing coordination value.
References
- BIMForum. Level of Development (LOD) Specification Part I & Commentary, 2021 edition. bimforum.org
- American Institute of Architects. AIA Document E203–2013: Building Information Modeling and Digital Data Exhibit. AIA, 2013.
- Fischer, M., Ashcraft, H., Reed, D., & Khanzode, A. Integrating Project Delivery. Wiley, 2017. [Stanford CIFE research base for BIM benefit metrics]
- McGraw-Hill Construction. The Business Value of BIM in North America 2007–2012. SmartMarket Report, 2012. [74% contractor positive ROI finding]
- National Institute of Building Sciences. National BIM Standard — United States (NBIMS-US), Version 3. nationalbimstandard.org
- buildingSMART International. IFC Specifications Database. technical.buildingsmart.org
- RICS. BIM for Cost Managers: Requirements from the BIM Model. RICS Guidance Note, 1st edition, 2015.
- Autodesk. Revit and Navisworks Product Documentation. autodesk.com
- US General Services Administration (GSA). GSA BIM Guide Series. gsa.gov

Be the first to comment.